
Transforming Raw Data Into Business Insights.
Data Analyst and Power BI Developer with 7+ years of experience in MIS reporting, dashboard development, SQL analysis and Python automation. I build clean, decision-ready reports that help teams understand performance and take action.
About Me
Data Analyst Focused on Business Reporting
I'm Prashant Karna, a Data Analyst and Power BI Developer with over 7 years of experience across MIS reporting, business analytics, SQL analysis and dashboard development.
My work includes building interactive Power BI dashboards, writing SQL queries, creating DAX measures, automating Excel-based reports and using Python to clean, process and extract data from different sources.
I enjoy converting raw and scattered data into clean, structured and decision-ready reports that help teams track performance, identify issues and take faster action.
Power BI Reporting
Dashboards, DAX measures, data modeling and KPI reporting
SQL Analysis
Joins, CTEs, window functions, validation and reporting queries
Python Automation
Pandas workflows, OCR automation, scraping and data processing
Excel & MIS
Advanced Excel, VBA macros, Power Query and recurring reports
Portfolio
Featured Case Studies
Real-world Power BI projects that transformed raw data into strategic business decisions.
.jpg)
HR Analytics Dashboard
Developed an interactive HR analytics dashboard to help HR leaders monitor employee attrition, workforce demographics, salary distribution and job-role level risk areas. The report converts raw HR data into clear decision points for retention planning.
- Tracked 1,470 employees across departments
- Analyzed 16.1% overall attrition rate
- Identified attrition patterns by age, salary and job role
- Enabled HR teams to spot high-risk workforce segments
Credit Card Transaction Report
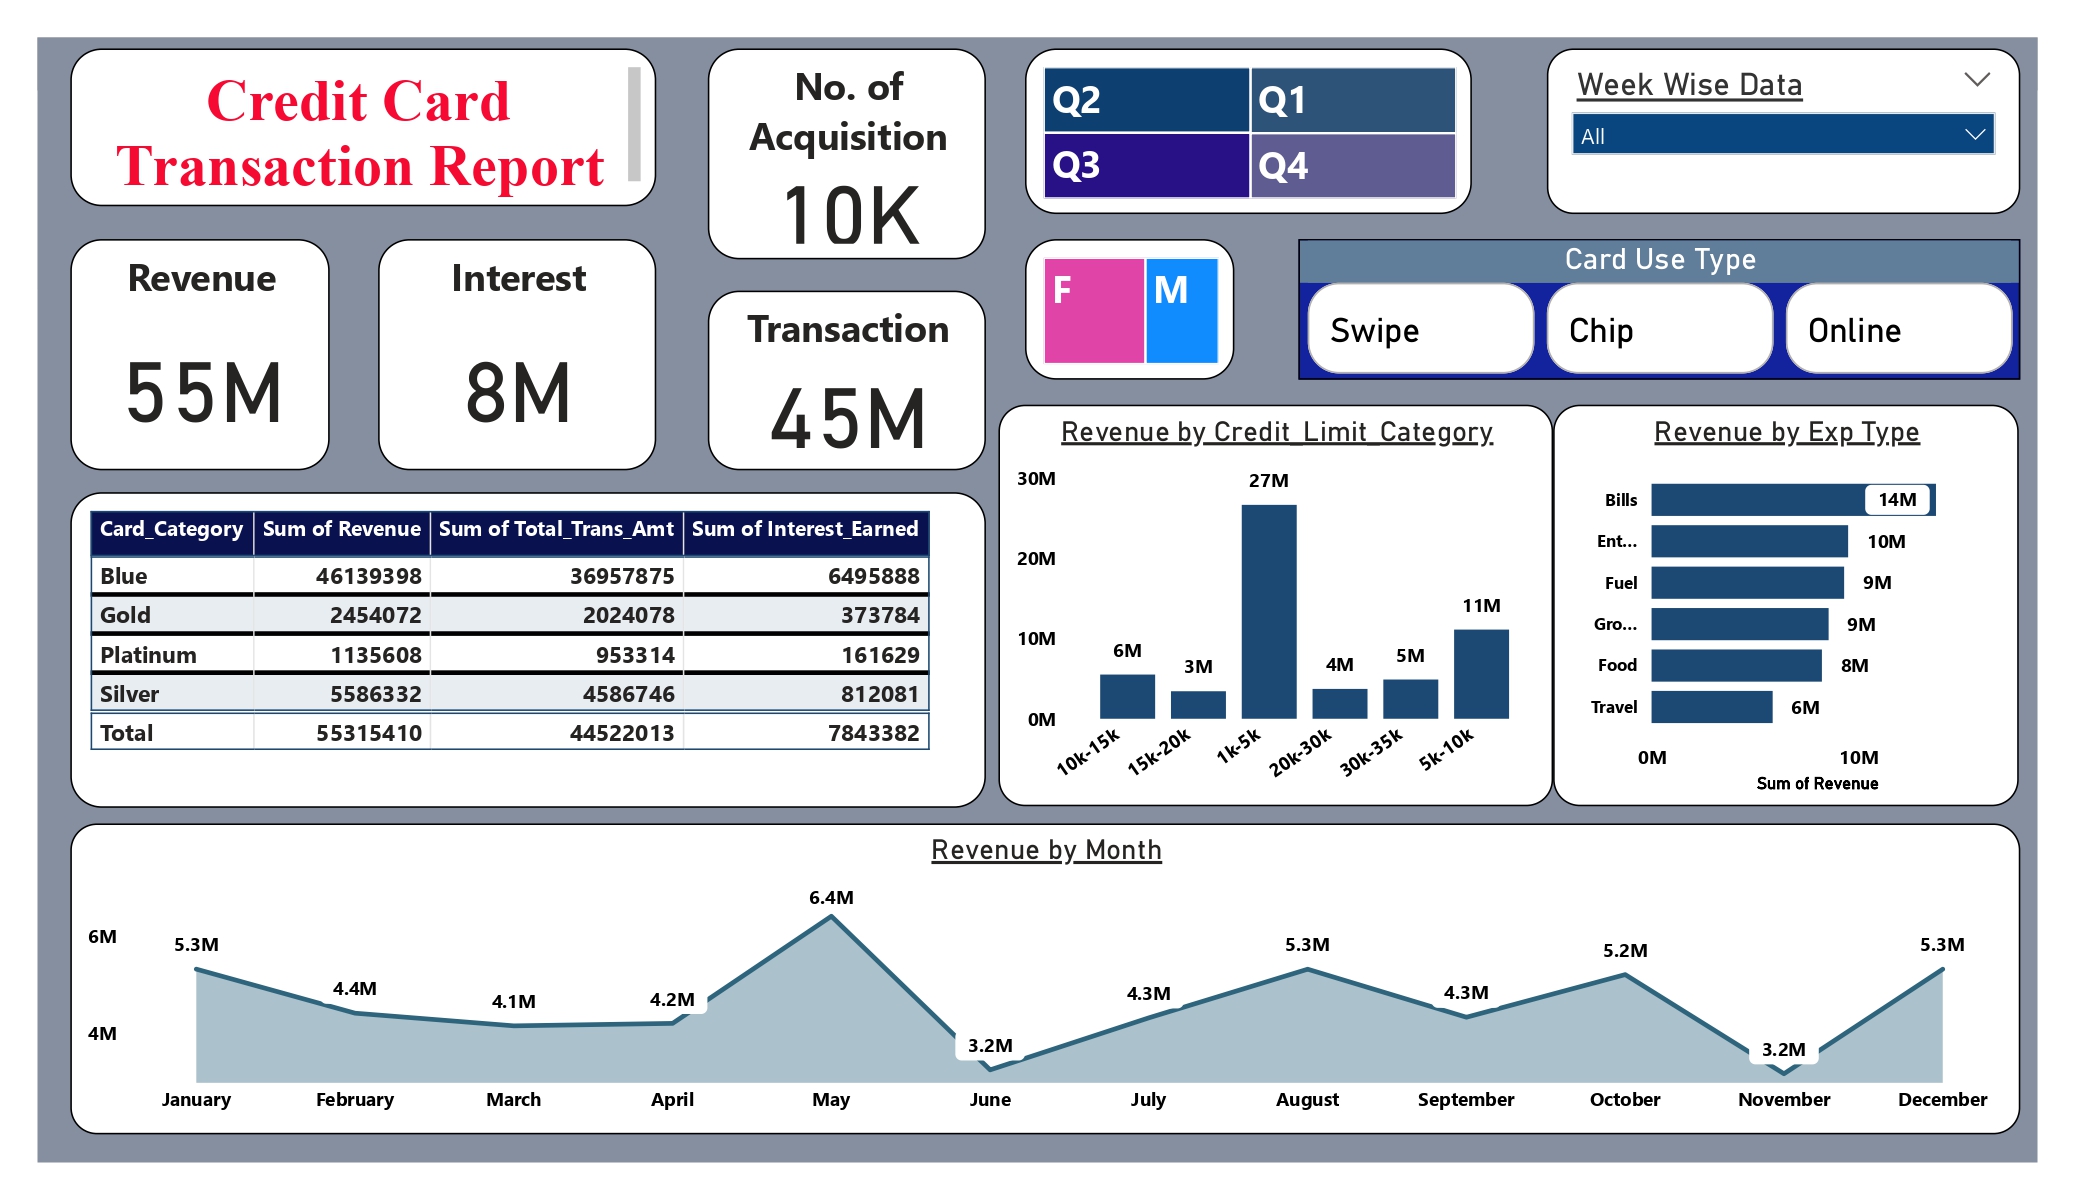
Built a Power BI transaction analysis report to track revenue, interest, transaction volume and acquisition performance. The dashboard helps users understand spending behavior, identify category-level trends and monitor financial performance over time.
- $55M revenue analyzed
- $8M interest tracked
- 45M transactions processed
- Monthly performance and category trends monitored
Credit Card Customer Report
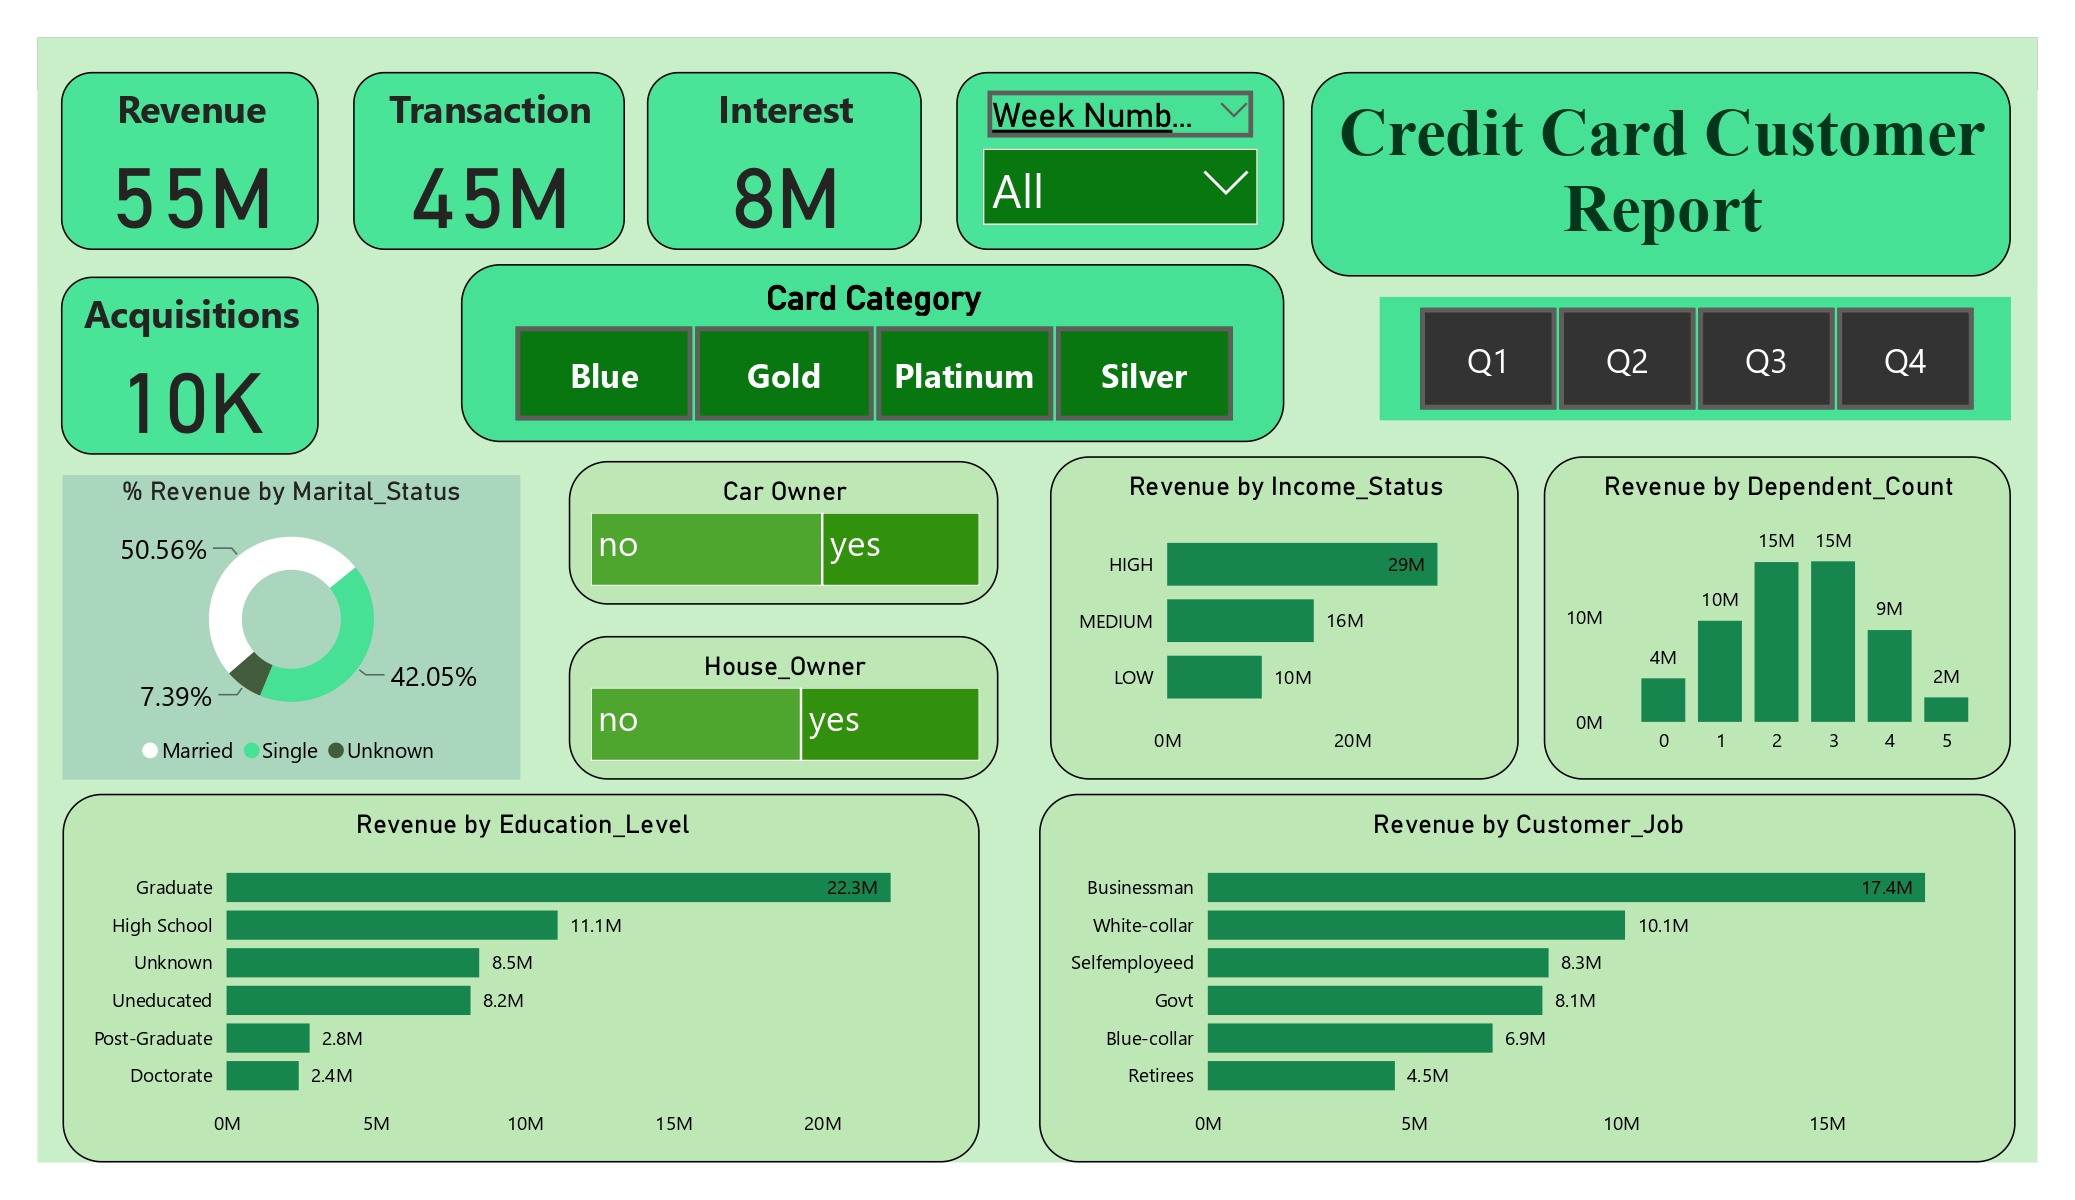
Created a customer analytics dashboard focused on customer profiling, segmentation and revenue contribution. The report highlights how income level, education, job type and family profile influence customer value and portfolio performance.
- Segmented customers by job, income and education
- Analyzed revenue by marital status and dependent count
- Compared customer behavior across ownership categories
- Supported targeted marketing and retention decisions
Data Science Salary Analysis
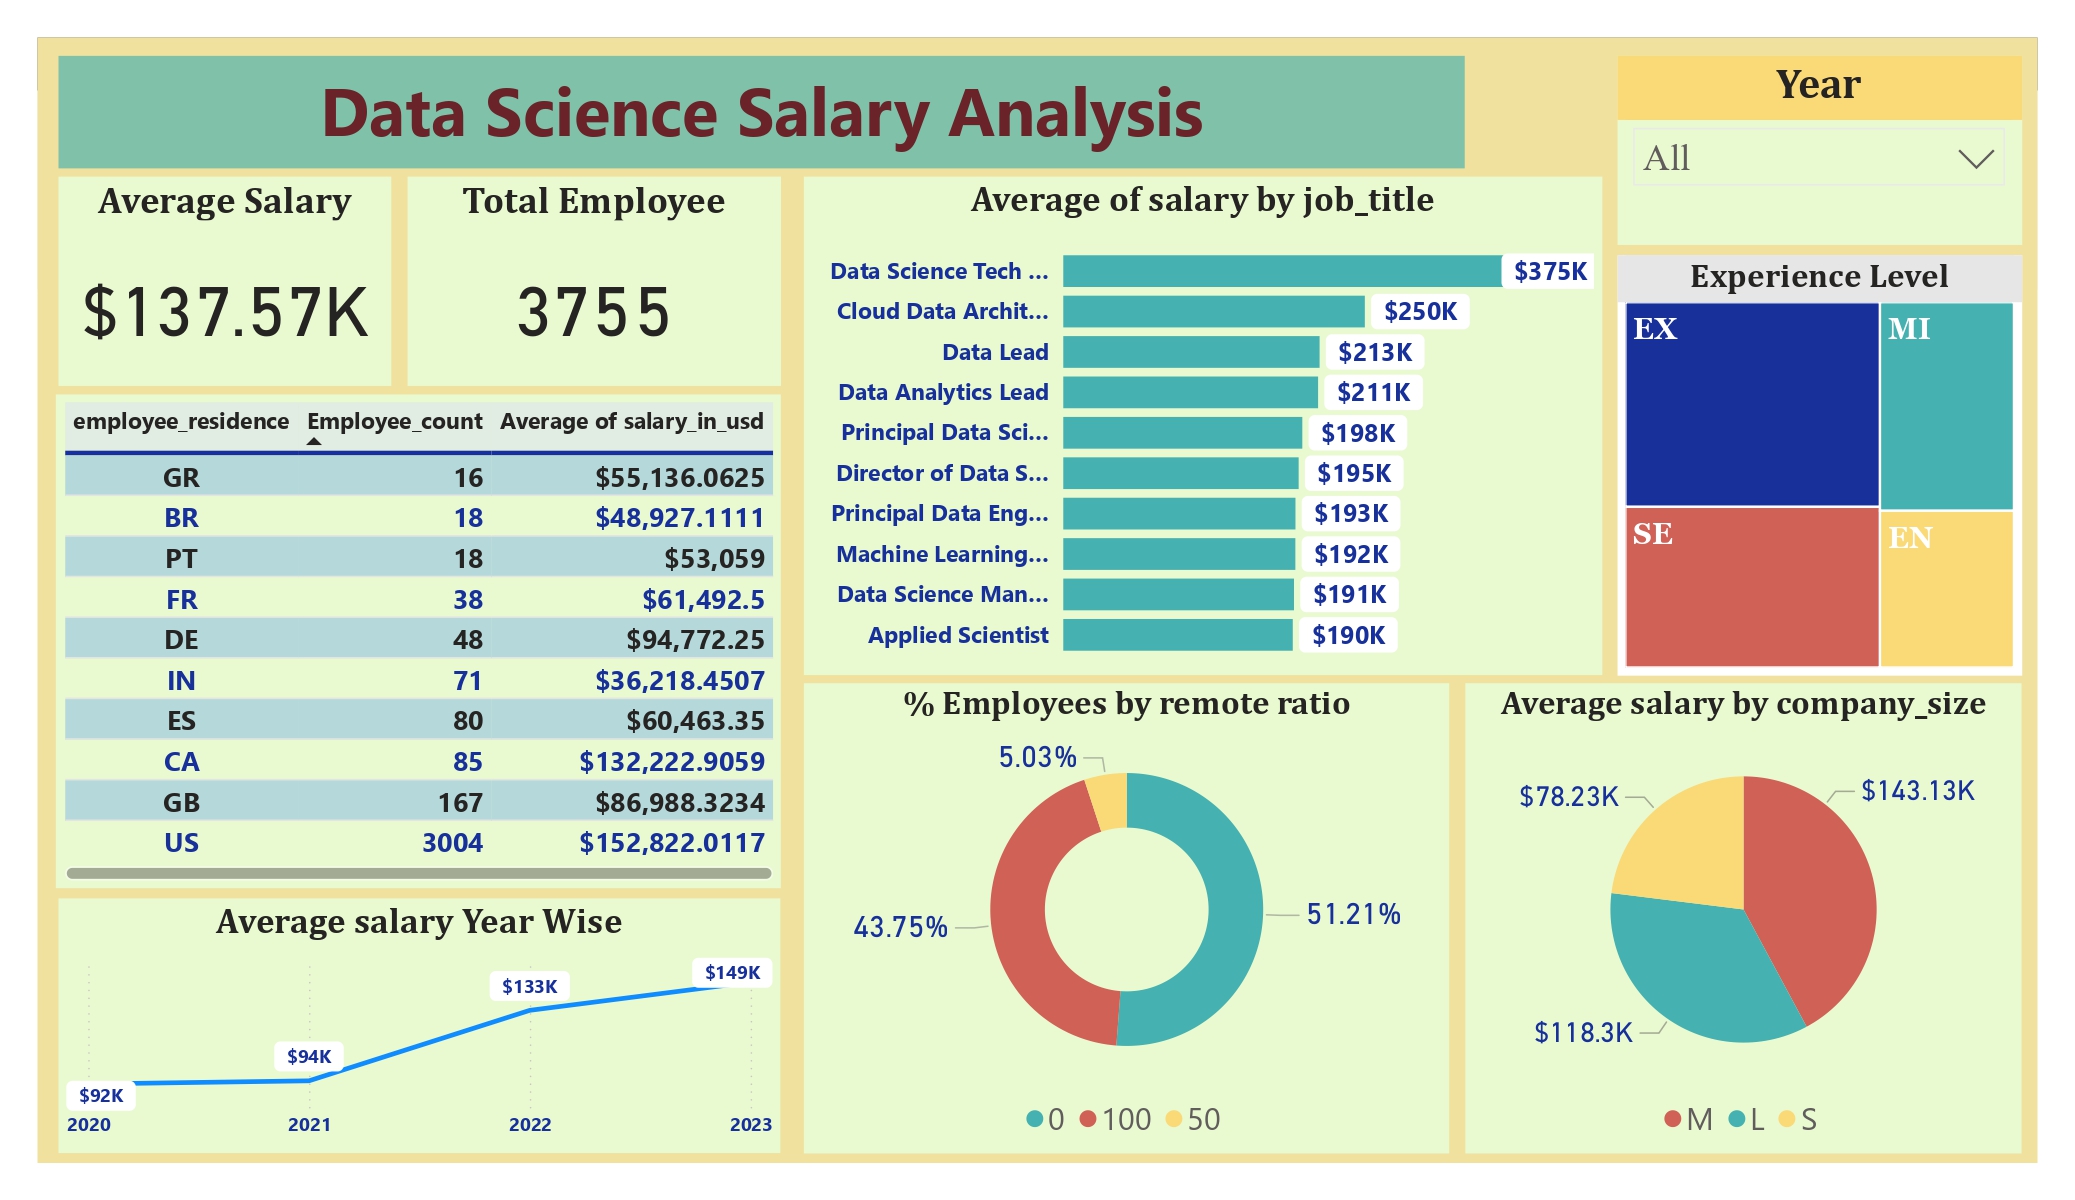
Designed a salary benchmarking dashboard using global data science compensation data. The report compares salaries by job title, experience level, company size, country and remote ratio to support career research and hiring-market analysis.
- Analyzed 3,755 global salary records
- Compared compensation across 10+ countries
- Benchmarked salary by experience and company size
- Explored remote-work and job-title salary patterns
Career Journey
Work Experience
7+ years across analytics, MIS reporting, finance operations, campaign analytics and business reporting.
Samvidhan Leadership Program
- Designed analytics dashboards and reports to monitor campaign and field performance metrics
- Performed large-scale election data analysis to identify constituency-level trends and anomalies
- Developed Power BI dashboards to support leadership decision-making and reporting
- Built Python-based automation and data extraction workflows for structured analysis
OrigaBee
- Served as the sole Data Analyst supporting operations for a U.S. pharmacy client
- Developed interactive Power BI dashboards and KPI reports using SQL Server data
- Built ETL and data-processing workflows using Python, Pandas and SQL
- Automated reporting processes, improving efficiency and reducing manual effort
- Designed DAX measures and data models for business reporting and decision-making
Choudhary Shah & Company
- Managed financial and operational data used for reporting and business analysis
- Prepared periodic MIS reports and dashboards for management
- Automated repetitive reporting tasks using Excel formulas, Power Query and VBA
- Maintained large datasets and ensured data accuracy and consistency
- Supported accounting, taxation and audit-related reporting activities
Vijayan's Fair & Exhibition Pvt. Ltd.
- Managed operational reports and maintained event-related data records
- Prepared MIS reports to track budgets, registrations and business activities
- Supported event operations through reporting and data management
- Coordinated with internal teams and stakeholders to ensure smooth execution of exhibitions and trade fairs
- Assisted management with data-driven planning and reporting
Expertise
Skills & Technologies
Practical data analytics toolkit covering Power BI, SQL, Python automation, Excel reporting and end-to-end dashboard development.
BI & Dashboarding
Databases & SQL
Python & Automation
Excel & MIS Reporting
Tools & Platforms
Analytics & Reporting
Growth
Currently Learning
Expanding from business intelligence into modern data engineering, distributed processing and advanced analytics workflows.
Databricks
Learning Lakehouse architecture, Delta Lake concepts and collaborative data engineering workflows for modern analytics platforms.
Apache Spark
Building understanding of distributed data processing, Spark SQL and PySpark for handling larger datasets beyond traditional SQL workflows.
Advanced SQL
Improving SQL depth through advanced joins, CTEs, window functions, query optimization and performance-focused reporting logic.
PL-300 Certification
Preparing for the Microsoft Power BI Data Analyst Associate certification to strengthen Power BI modeling, DAX and service-level knowledge.
Technical Work
Technical Projects
A collection of SQL, Python automation, ETL, Excel VBA and Power BI work demonstrating practical data analysis and reporting skills.
Music Store SQL Analysis
Analyzed music store sales and customer data using joins, CTEs, window functions and aggregations to answer business questions and identify sales patterns.
- Performed customer and sales analysis
- Used joins, CTEs and aggregations
- Answered business-focused SQL questions
Bihar Voter Roll OCR Automation
Built an OCR pipeline to convert thousands of Bihar voter-roll PDF files into structured tables for district, block and village-level analysis.
- Converted PDF voter rolls into tables
- Created structured datasets from OCR output
- Enabled location-wise voter analysis
Excel VBA Reporting Automation
Developed VBA macros to automate repetitive reporting tasks, merge large datasets, create subtotals and process high-volume Excel files efficiently.
- Automated repetitive Excel tasks
- Processed large datasets efficiently
- Reduced manual reporting effort
ETL & Data Processing
Built ETL workflows for extracting, cleaning, transforming and preparing business data for analytics and dashboard reporting.
- Cleaned and transformed raw datasets
- Prepared reporting-ready data models
- Worked with SQL Server data sources
Web Scraping Automation
Automated data collection from dynamic websites using browser automation and scraping techniques to reduce manual data-gathering work.
- Automated browser-based workflows
- Collected structured website data
- Reduced manual collection effort
Power BI Dashboard Development
Designed interactive dashboards for HR analytics, financial analytics and salary benchmarking using Power BI, DAX and Power Query.
- Built interactive business dashboards
- Created DAX measures and KPIs
- Delivered decision-ready reporting
Get In Touch
Let's Work Together
Open to Data Analyst, Power BI Developer and Business Intelligence roles where I can help teams turn data into clear, decision-ready reporting.
Prashant Karna
Data Analyst · Power BI Developer · 7+ Years Experience